
Customer service KPIs: what to measure in your phone support
November 6, 2026
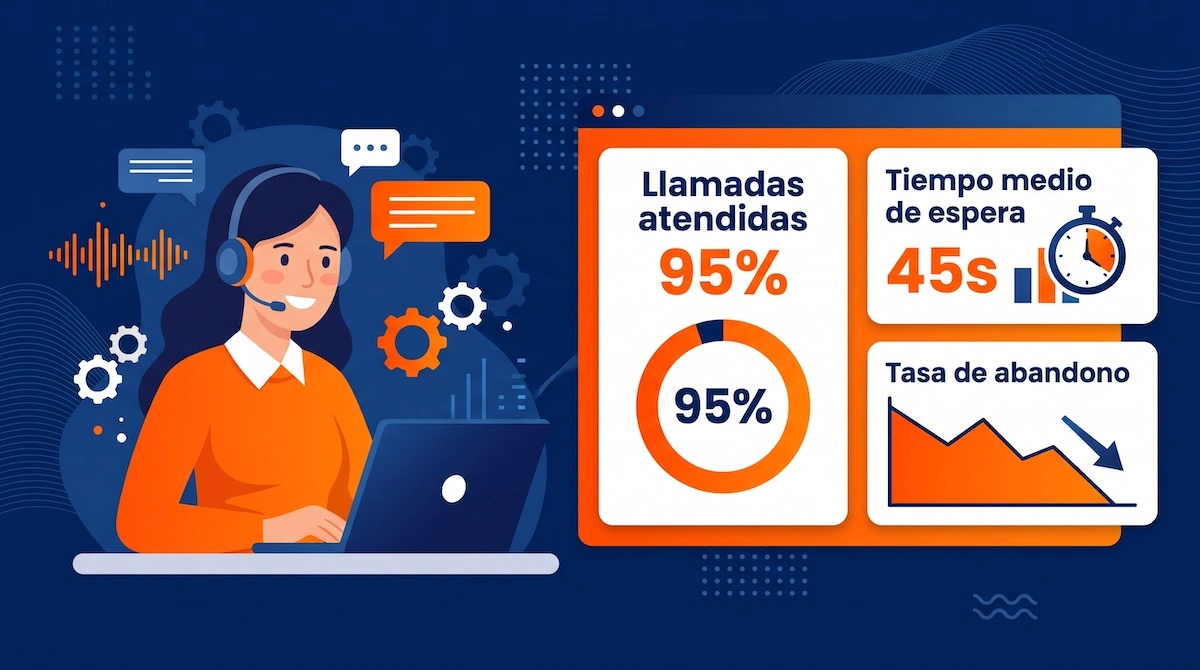
Only 56% of the calls that businesses receive are answered by a person, according to Invoca's study based on the analysis of 70 million calls. The rest end up in a voicemail box, a dead-end menu or a ringing phone that nobody picks up. If you don't measure what happens in your calls, you don't know how many customers are lost along the way. That is why customer service KPIs are a management issue: Law 10/2025 turns some of them into a legal obligation, and the adaptation period ends on 28 December 2026.
In this guide we review what customer service KPIs are, what the phone support law requires, the ten metrics worth measuring, and how to improve them with a virtual PBX.
What customer service KPIs are and why telephony provides the best data
A customer service KPI is a numerical indicator that tells you whether your support is working: whether you respond quickly, whether you resolve issues, whether the customer leaves satisfied, and how much it costs you to achieve this. Useful KPIs share three traits: they are always calculated the same way, they can be compared over time, and they lead to a concrete decision (more agents in a given time slot, a different IVR menu, a different script).
The phone is the channel that lends itself best to measurement, because every call leaves a record: time of arrival, waiting time, duration and, where applicable, a recording. In a chat or an email, much of that information has to be reconstructed.
It is also the channel that carries the most weight. According to the 2025 Market Study by the Customer Experience Association (CEX) in Spain, the phone accounts for 69% of contact center interactions (data from its members). Natterbox puts the growth in voice volume at +16.1% in 2025.
What Law 10/2025 requires of phone support
The customer service law sets minimum quality standards for support in Spain for the first time. Several of them are measured directly on the phone, so it is worth knowing them before choosing your KPIs.
These are the points that affect phone support according to the BOE (Spain's Official State Gazette).
Who it applies to
Law 10/2025 (art. 2) applies to companies providing basic services of general interest, including telecommunications, regardless of their size. For all other companies, it applies if they exceed any of these thresholds:
- 250 or more employees.
- More than 50 million euros in annual turnover.
- More than 43 million euros in balance sheet total.
If your SME falls outside its scope, you can use it as a reference to set your own customer service targets.
95% of calls answered in under 3 minutes on average (arts. 8.2 and 10.3)
This is one of the most frequently cited requirements. The law requires that 95% of calls be answered within an average time of under 3 minutes. Since the law does not specify how this average is to be calculated, it is advisable to document a measurement method and apply it consistently.
Reality shows there is still a way to go. Ceveco's 2025 Phone Response Quality Study, based on 18 insurers representing 85% of the market, puts the share of calls answered in under 3 minutes at 87.41%, which means the insurance sector has yet to reach the 95% threshold.
Right to speak to a person (art. 8)
An IVR or a bot cannot be the only support channel. The customer must have an option to ask to speak to an operator. If they ask, they must be able to reach a supervisor within a maximum of 3 minutes; if that is not possible, they must receive a call back the same day. Hanging up on a call because of waiting time is prohibited.
Recording of complaints and claims (art. 12.1)
When a customer files a complaint or claim by phone and agrees to have the conversation recorded, the company must keep that recording until the claim is resolved. This means the PBX must allow recording to be activated for these calls, the customer to be informed, and their consent to be collected before recording.
In addition, complaints and claims must be resolved within 15 business days (art. 17). For billing matters the deadline drops to 5 business days, and for outages of continuous basic services, to 2 hours.
Measuring and auditing (arts. 18, 21 and 22)
The satisfaction survey can only be sent after the issue has been resolved. In addition, companies must periodically evaluate and audit their claims management system to verify that it works properly. These reviews are carried out every year in large companies and every two years in obligated companies that do not reach that size. Measurements must have a maximum margin of error of 5%.
The adaptation period is 12 months, which means until 28 December 2026.
The phone support KPIs you should measure
To evaluate how your phone support service performs, it is worth analyzing each phase of the call: from the time the customer waits to the resolution of their query. The following metrics cover the full life cycle of a call, from the moment it comes in until the customer hangs up.
For each one, we provide a definition and formula and, where it can be verified, a reference value. Where there is no reference value, you can set your own baseline and improve it month by month.
-
Service level
Percentage of calls answered within a time threshold. It is the KPI that comes closest to what the law requires. It can also be searched for as "call center service level".
Formula: calls answered in ≤ X seconds ÷ calls received × 100
Reference: the law establishes that 95% of calls must be answered in an average of less than 180 seconds. As an additional reference, contact center management commonly uses the "80/20" standard, which sets the goal of answering 80% of calls within a maximum of 20 seconds. The latter is a common industry criterion, not an obligation or a universal standard.
-
Average waiting time
How long the customer takes to be answered from the moment they enter the call queue. This figure tells you whether customers get a quick response or spend too long waiting.
Formula: sum of waiting times ÷ calls answered.
Reference: Natterbox puts the average at 0.81 minutes of waiting in the call queue. In the insurance sector in Spain, Ceveco measured an average wait of 65 seconds.
Note: For a more complete picture, it is also worth identifying how many customers wait longer than a given time. A low average time can also hide cases in which some people wait much longer than usual to be answered.
-
Time in IVR
Time the customer spends in the automated menu before reaching the queue or an agent. An IVR that is too long is a disguised wait, putting you at risk of the customer getting tired and hanging up. The law reminds us that it cannot be the only means of support.
Formula: sum of time in IVR ÷ calls that go through the menu
Reference: Natterbox puts the average at 2.37 minutes, with a 54% reduction in one year, thanks to replacing static IVR menus with conversational AI routing. Ceveco measured 63 seconds of IVR before the queue.
-
Abandonment rate
Percentage of customers who hang up before being answered. It is the clearest symptom that the wait is excessive. To avoid a false figure, you can exclude hang-ups of less than 10 seconds caused by dialing errors or reflex hang-ups, which according to Verint can reach 2% of volume.
Formula: abandoned calls (after 10s) ÷ calls received × 100
Recommendation: you can set a starting value and monitor it periodically to check whether the rate decreases. If you detect an increase in abandoned calls, especially in certain time slots, review waiting times, agent availability and the PBX's call distribution.
-
Answer rate and missed calls
Missed calls are those that nobody answers, whether due to lack of staff, because they come in outside business hours, or because of saturation. For a consumer, an unanswered call is a problem, but for a company it is possibly a customer who doesn't come back.
Formula: calls answered ÷ calls received × 100
Reference: according to Invoca (Telecom Benchmarks 2026), 56% of calls to businesses are answered by a person, and in telecommunications this drops to 51%. Routing strategies, queues and callbacks are the main starting point.
-
First call resolution (FCR)
Percentage of queries that are resolved during the first call, without the customer having to contact the company again. It is probably the KPI with the greatest impact because it lets you assess the team's ability to solve problems from the outset; it also reduces repeat calls and improves the customer experience.
Formula: cases resolved on the first call ÷ total cases × 100
Reference: according to SQM in its study on first call resolution, the industry average is 71%; between 70 and 79 is considered good and above 80% is world-class. In telecommunications it drops to 56%. SQM also calculates that each point of FCR improvement reduces operating costs by 1%.
As for the causes that prevent a query from being resolved on first contact, 49% are related to company processes, 38% to the agent's performance and 13% to the customer themselves. These data show that a significant share of unresolved calls depends on how the customer service operation is organized.
FCR varies greatly by sector. In SQM Group's First Call Resolution Benchmark, retail leads with 77%, followed by insurance (75%) and NGOs (73%), all above the overall average of 71%. Technical support stands at 64% and telecommunications at 56%. These are data from North American centers; they serve as guidance but are not equivalent to the Spanish average.
-
Average handling time (AHT)
The average duration of a complete call, including conversation, holds during the call and after-call work. A low AHT is not necessarily good, because if that figure is achieved at the cost of resolving less, or quickly and poorly, FCR gets worse.
Formula: (talk time + hold time during the call + after-call work) ÷ calls handled
Recommendation: there is no average handling time that is valid for all companies, since it depends on the complexity of the queries and the type of service. You can analyze AHT by type of call and compare it with your own results over time. If the average time decreases, check that FCR and customer satisfaction are maintained or improve.
-
Customer satisfaction (CSAT)
Measures how satisfied the customer is after the interaction. It is usually calculated through a survey in which the customer is asked to rate the experience, normally on a scale of 1 to 5.
According to CEX, CSAT and NPS (net promoter score) are the most widely used metrics in Spain. The difference is that the former measures satisfaction with a specific interaction, such as a call, while the latter measures the overall relationship with the brand and is usually launched periodically.
The law adds a condition: the survey must always be sent after the issue has been resolved.
Formula: satisfied responses (4 and 5) ÷ total responses × 100
Recommendation: it is advisable to track results periodically and analyze them together with FCR and average waiting time to understand how these factors influence customer satisfaction.
-
Contact rate on outbound calls
If your team makes outbound calls, the metric is how many of those calls are answered. According to Hiya (State of the Call 2026), 86% of calls from unknown numbers go unanswered. That is why it is important that customers can identify who is calling and recognize the reason for the call.
Formula: calls answered ÷ calls made × 100.
Recommendation: identifying the call properly and choosing a good numbering scheme is what makes the difference. In our article on 400 numbers and sales calls we explain how it works.
-
Phone conversion
For sales or lead-generation teams, it measures what share of calls ends in business. According to Invoca, 38% of answered calls are leads and 42% of those convert on the call itself.
Formula: leads converted on the call ÷ phone leads × 100
To see how much is lost along the way, it is worth looking at the complete path of the call. According to Invoca (Lead Conversion Benchmarks Report 2026), out of every 100 inbound calls to businesses only 56 are answered by a person. Of those, 38% are potential customers (approx. 21 calls) and 42% of those leads buy during the same call (approx. 9).
In other words, only one in ten calls ends in a sale, and 44 out of every 100 never even get to speak to a person.
How to improve each KPI with your virtual PBX
Measuring phone support indicators lets you know what works well and where the main problems occur: unanswered calls, long waiting times, dissatisfied customers. However, tracking this data makes more sense when it is done to introduce improvements to the service.
A virtual PBX lets you act on many of these indicators from its own configuration. The following table shows which virtual PBX features can improve each KPI.
|
KPI |
PBX function |
|
Service level |
Call queues with distribution rules among agents and adjustments by time slot. |
|
Average waiting time |
Automatic call distribution, agent groups and diversions to prevent calls from piling up in a queue. |
|
Time in IVR |
Shorter, clearer voice menus, with direct options to speak to an operator. |
|
Abandonment rate and missed calls |
Callbacks and diversions to other agents or numbers, especially at peak hours and outside normal hours. |
|
First call resolution (FCR) |
CRM integration so the agent can check the customer's history and has access to information during the conversation. |
|
Contact rate on outbound calls |
Call identification through appropriate numbering. |
|
Agent productivity |
Reports on calls answered, calls made, duration and activity per agent. |
|
Customer satisfaction (CSAT) |
Automatic surveys after the call to collect the customer's rating. |
|
Quality of customer service |
Call recording and transcription to review conversations, detect errors and evaluate how the customer is being served. |
Artificial intelligence has a role to play here too. According to Salesforce, in Spain the cases resolved by AI will go from 30% in 2025 to 50% in 2027. An AI voice agent can absorb repetitive calls, ease peak hours and call the customer back when they cannot wait. It is an option that improves many of the indicators mentioned in this article. However, the law requires that there always be a way to speak to a person, so transfer to a human agent is not optional.
How to measure your KPIs with Megacall
To measure the performance of your phone service with Megacall, you can use the PBX statistics, the analytics of AI agent calls, conversation search and CRM data. Each tool provides information on a different part of customer service and lets you calculate or analyze different indicators.
From the statistics section you can consult:
- The volume of inbound and outbound calls.
- The duration of conversations.
- The evolution of this data through comparisons between different periods.
- The workload of operators and the behavior of calls on hold from the "Queues" section.
From Megacall CRM you can consult each customer's interaction history and use it to analyze:
- First call resolution (FCR): check whether the customer contacts you again for the same reason after their first call. Take the opportunity to send a customer satisfaction survey.
- Repeat call rate: identify recurring contacts related to the same issue.
- Resolution time: track the time that elapses from when an issue is logged until it is resolved.
For its part, the AI voice agent lets you analyze the performance of automated support. You can review which queries it handles, which ones require transferring the call to an operator, and which requests recur most often. This information helps identify which tasks can be automated and how to better distribute work between the virtual agent and the human team.
We recommend reviewing the indicators periodically, comparing them by date, time slot and agent, and analyzing them together. For example, if average handling time (AHT) decreases, also check that first call resolution (FCR) and customer satisfaction are maintained or improve.
If you want to start measuring and improving customer service, you can do so with Megacall's Lite plan, for €20/month (billed annually), which includes a virtual number, call minutes, plus the free PBX and CRM. You can also start by contracting only the virtual number (from €2/month for Spanish geographic numbers and from €3/month for 400 numbers, billed annually) and topping up credit for the outbound calls you make; this would be the Standard plan.
FAQs: customer service KPIs
What is a good first call resolution percentage?
As a reference, SQM puts the call center industry average at 71% first call resolution. However, this value can vary depending on the sector and the complexity of the queries. What matters is improving the percentage without harming the quality of service and customer satisfaction.
How long can a customer wait on the phone according to the law?
Article 10.3 of Law 10/2025 establishes that companies within its scope of application must answer, on average, 95% of calls received in under 3 minutes. In addition, calls cannot be cut off because of waiting time, and access to a supervisor or a same-day callback must be offered.
Does Law 10/2025 apply to my company?
If you provide basic services of general interest (including telecommunications), yes, regardless of your size. In other sectors, if you have 250 or more employees, more than 50 million euros in turnover or more than 43 million euros in balance sheet total. It also applies if you outsource customer service. If you meet none of those criteria, you are not obligated, but you can use it as a reference standard.
Which KPIs should an SME with few agents measure?
An SME with a small team can start with five basic indicators: answer rate, average waiting time, abandonment rate, first call resolution and average handling time. These data make it possible to detect calls that go unanswered, excessive waits and possible problems in service.
Sources
BOE, Law 10/2025, of 26 December, regulating customer service:
https://www.boe.es/buscar/act.php?id=BOE-A-2025-26698
Ceveco, Phone response quality study 2025 (via SegurosNews):
Hiya, State of the Call 2026:
https://www.hiya.com/state-of-the-call
Invoca, Telecom Benchmarks 2026:
https://www.invoca.com/reports/the-invoca-lead-conversion-benchmarks-report-2026
Natterbox, State of the contact center 2026:
https://natterbox.com/contact-center-benchmarks-2026-report/
Qualtrics XM Institute, Contact Center Trends 2025:
https://www.qualtrics.com/research/contact-center-2025/
SQM Group, First Call Resolution Benchmark:
https://www.sqmgroup.com/resources/library/blog/fcr-metric-operating-philosophy
You may also like…
Customer service KPIs: what to measure in your phone support
November 6, 2026

Aircall vs Megacall and alternatives: reviews and comparison
November 4, 2026

Getting a SIP Trunk: How it works and what you need
October 26, 2026